

Yes, team building ROI is measurable when you set a baseline and track the right metrics. The simplest version is a 3-number framework: cost per person, the baseline metric before the event, and the delta 60 to 90 days after. Track that consistently and you have a defensible business case, not a hopeful guess.
The metrics that matter most sit in five categories:
- Retention and regretted attrition (not general turnover)
- Engagement scores, whether Gallup Q12 or an internal pulse
- Absenteeism rates before and after
- Productivity proxies such as output or cycle time
- Event NPS or eNPS, the fastest signal you get on the day
A 5-point improvement in engagement can justify a full year’s team-building budget, according to UC San Diego’s INSTEP research on team development, which also recommends measuring change at the 60 to 90 day mark rather than immediately after the event.
Key Takeaways
Team building ROI becomes defensible once you set a baseline, track regretted attrition separately from general turnover, and present results as conservative ranges rather than single-point claims.
| Point | Details |
|---|---|
| Use the 3-number framework | Track cost per person, baseline metric, and the delta at 60 to 90 days post-event. |
| Prioritise retention ROI | Calculate cost per departure as salary × 0.5 to 2.0 multiplier, then compare avoided cost to event spend. |
| Separate regretted attrition | Only count departures of employees you’d have wanted to keep when claiming avoided cost. |
| Benchmark conservatively | Expect engagement gains of roughly 2 to 5 points and present sensitivity ranges, not single figures. |
| Capture event-level data live | Use role rotation and scoreboard participation during activities like laser clay to log engagement as it happens. |
Table of Contents
- Why finance questions team building ROI and what to expect realistically
- Which metrics actually predict team building ROI?
- A step-by-step system for measuring team building ROI
- Calculating retention ROI: the formula and a worked example
- What good engagement and retention numbers actually look like
- Where team building ROI claims go wrong
- Measuring engagement and collaboration during a laser clay event
- Why consistent measurement beats one-off events
- Sources
- FAQ
Why finance questions team building ROI and what to expect realistically
Ask a CFO to sign off on a team-building budget and you’ll get the same three questions every time: what did the last one achieve, how do you know, and why should this one be different? Fair questions. Most HR teams can’t answer them because they never captured a baseline.
The fix starts with separating lagging indicators from leading ones.
- Lagging indicators (turnover, absenteeism) move slowly and confirm what already happened.
- Leading indicators (meeting participation, message volume across teams) shift faster and let you course-correct before the lagging numbers turn.
Timelines matter too. Post-event satisfaction spikes immediately and means little on its own. Behavioural change, according to practitioner guidance from TeamBonding’s ROI research, typically surfaces within 30 to 90 days. Retention effects take longer still, often a full quarter or two.
Set expectations accordingly. Team building reliably improves social cohesion, trust and internal process metrics. It rarely produces an immediate revenue spike, and claiming one damages your credibility with finance far more than a modest, well-evidenced number ever would.
Which metrics actually predict team building ROI?
Not every metric deserves equal weight. Some tell you what happened; others tell you what’s about to happen. Building your measurement stack means picking from three tiers.
- Direct engagement metrics. Gallup Q12 or an internal pulse survey, run before and after, gives you the cleanest signal on morale and psychological safety. Event NPS captures immediate reaction; eNPS captures the durable version weeks later.
- Indirect business metrics. Turnover, and specifically regretted attrition, is the metric finance cares about most because it has a hard cost attached. Absenteeism and productivity proxies, such as output volume or cycle time on shared projects, round this out.
- Leading behavioural indicators. Meeting participation rates, cross-team requests, and collaboration tool activity often move within days of an event, well before turnover or absenteeism shift at all.
The CIPD’s evidence review on high-performing teams found that team-building interventions produce a moderate-to-large effect on social cohesion and related process outcomes when they target interpersonal relations, problem-solving or role clarification specifically, rather than generic socialising. That’s the design detail most measurement guides skip: the metric stack only works if the event itself is built to move a named outcome.
A step-by-step system for measuring team building ROI
You don’t need a data science team for this. You need four disciplined steps, run in order, every time.
- Define the objective and pick one primary metric. Retention or engagement, not both. Trying to move five metrics with one event dilutes your ability to claim credit for any of them.
- Establish your baseline at least two weeks before the event. Run the same survey or pull the same turnover data you’ll use afterwards. Where you can, track a comparable team that isn’t attending as an informal control group.
- Collect data at three points. An immediate post-event NPS, then structured pulses at 30, 60 and 90 days. This is the cadence TeamBonding’s practitioner guidance recommends, and it matches the window in which behavioural change typically shows up.
- Pair the numbers with qualitative evidence. Manager observations, anecdotes about who’s now collaborating who wasn’t before, specific process complaints that stopped. Numbers alone rarely persuade a room; numbers plus a specific story usually do.
Pro Tip: Keep a simple spreadsheet log of “before” quotes from managers alongside the baseline numbers. Six months later, that qualitative record is often more convincing to leadership than the metric delta itself, because it shows the change in someone’s own words.
Calculating retention ROI: the formula and a worked example
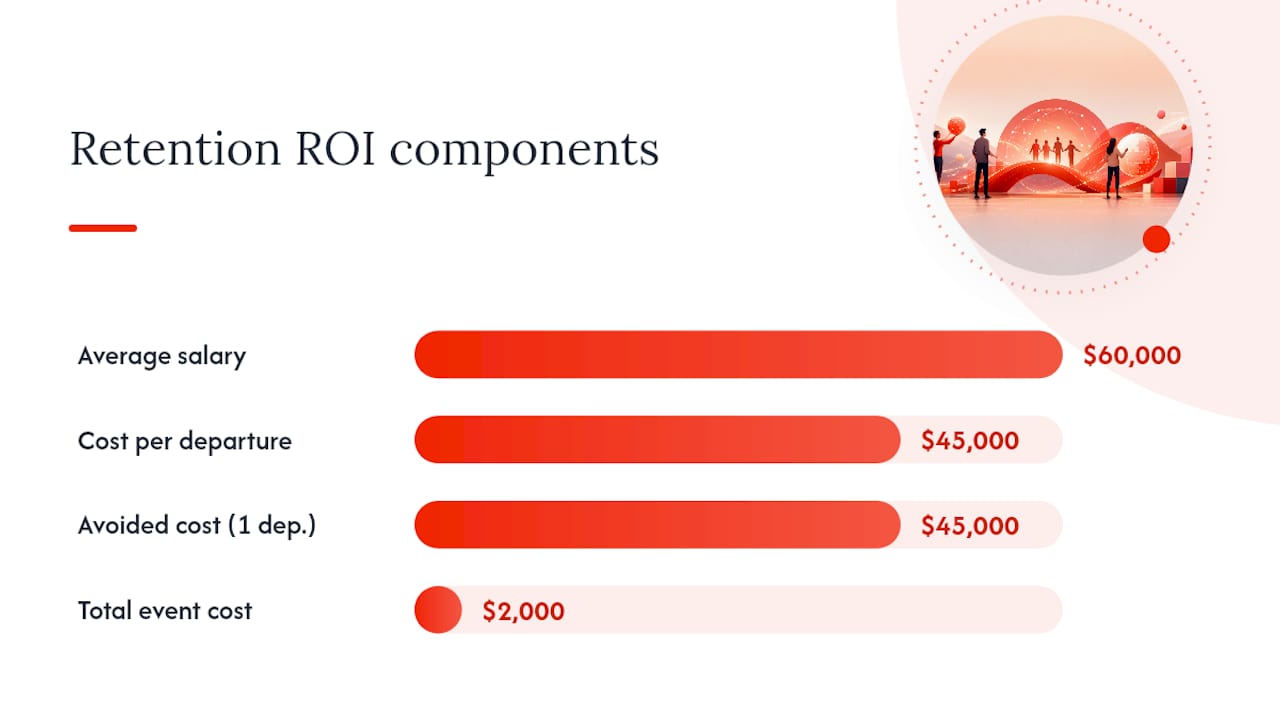
Retention is where the maths gets concrete, because turnover has a real cost attached to it. The formula:
ROI = (Avoided turnover cost − event cost) / event cost × 100
Getting there requires three steps:
- Cost per departure = annual salary × a replacement multiplier of 0.5 to 2.0, a range recommended by Outback Team Building’s ROI guidance to account for recruitment, onboarding and lost productivity.
- Estimate departures prevented, attributed conservatively to the event rather than claimed in full.
- Compute net ROI against total event cost.
Here’s a conservative worked example. A 20-person team costs $2,000 total for a half-day event, or $100 per head. Average salary is $60,000, and you apply a modest 0.75 replacement multiplier, putting cost per departure at $45,000. If you conservatively attribute just one prevented departure to the event (not five, not two), avoided cost is $45,000. Net ROI: ($45,000 − $2,000) / $2,000 × 100 = 2,150%. Even crediting the event with a fraction of that one departure still clears the cost easily, which is why retention is the metric finance tends to find most persuasive.
What good engagement and retention numbers actually look like
Benchmarks help you sense-check your own results rather than presenting a single flattering number in isolation. Realistic post-event ranges tend to look like this:
- Engagement score improvements of roughly 2 to 5 points on a standard pulse scale, sustained at the 90-day mark.
- eNPS shifts of a similar modest scale; a jump of 10+ points sustained past 90 days is a strong result, not a typical one.
- Turnover improvements vary heavily by team type. Interdependent, project-based teams tend to show larger movement than loosely coupled or fully remote teams, where social distance takes longer to close.
Present these as ranges, not point estimates. A stakeholder who sees “we expect a 2 to 4 point engagement lift” trusts you more than one who sees a single suspiciously precise number, because ranges signal you understand the uncertainty rather than hiding it.
Where team building ROI claims go wrong
Most inflated ROI claims share the same three flaws, and all three are avoidable.
- No baseline. Without a “before” number, any “after” figure is meaningless, however impressive it looks.
- Conflating general turnover with regretted attrition. Losing an underperformer isn’t a cost; losing your best analyst is. Guidance on employee retention in Singapore stresses tracking these separately, since only regretted attrition carries the replacement cost that justifies your ROI maths.
- Single-point claims with no sensitivity range. Present ROI at low, medium and high attribution levels, crediting the event with a smaller or larger share of the observed change, so stakeholders see a defensible range rather than one number that collapses under scrutiny.
Triangulate wherever you can: pair the quantitative delta with a control group and a qualitative story, and your case survives the first hard question in the room.
Measuring engagement and collaboration during a laser clay event

A well-designed activity gives you measurement hooks the moment it starts, not just a satisfaction score afterwards. Laserclay’s format, for instance, runs on real-time electronic scoreboards and role-based tasks, which means participation, accuracy and team coordination are all logged as the event happens rather than recalled later from memory.
On the day, capture: participation rate across the group, role rotation (who led, who supported), and live scoreboard engagement. Afterwards, compare these against your baseline engagement pulse and 30/60/90-day retention tracking.
A scored, role-based format turns “did people enjoy it” into “who stepped up, who collaborated across usual team lines, and did that show up in the metrics weeks later.” That’s the difference between a nice afternoon and a data point.
Laserclay’s corporate team-building programme is built around exactly this kind of role rotation and live scoring, giving planners something concrete to log rather than a vague impression.
Why consistent measurement beats one-off events
The best HR teams I’ve seen don’t chase a single perfect ROI number. They run small, honest experiments, log the data quarter after quarter, and let the pattern build credibility over time.
Claim less than you could. Document more than you’re asked to. One modest, well-tracked event with real numbers behind it wins more budget next year than any single glowing anecdote ever will.
— Joshua
Sources
For deeper methodology, see the CIPD evidence review on high-performing teams, UC San Diego’s INSTEP team development resources, Outback Team Building’s ROI framework, the Small Group Research meta-analysis on team-building effectiveness, and TeamBonding’s practitioner ROI guidance.
- Team development interventions — UC San Diego (INSTEP)
- High-performing teams: an evidence review — CIPD
FAQ
What are the 5 P’s of team building?
Common frameworks vary, but most versions cover purpose, people, place, process and performance, used as a checklist for designing an event around a clear objective rather than generic socialising.
What are the 7 C’s of building a winning team?
Definitions differ across sources; a common version includes communication, collaboration, commitment, confidence, coordination, complementary skills and conflict management, each acting as a lever you can measure indirectly through engagement or eNPS.
How do I explain team building ROI to finance?
Present the 3-number framework (cost per person, baseline, and post-event delta), use the retention ROI formula with a conservative replacement multiplier, and show a sensitivity range rather than one fixed figure.
What are the 5 stages of team development?
Bruce Tuckman’s model names forming, storming, norming, performing and adjourning; team-building activities most reliably accelerate the norming stage by building trust and clarifying roles faster than time alone would.
How soon after an event should I measure results?
Run an immediate event NPS on the day, then structured pulses at 30, 60 and 90 days, since behavioural and retention changes typically take that long to appear.